First Time Setup
Creating the Project
To quickly scaffold out a template game using Hex Engine, you can use the npm package create-hex-engine-game. Pick a directory where you want to make your game, then run the following in a terminal emulator or command prompt:
npx create-hex-engine-game@latest my-game
You can change my-game to whatever you want; that's the name of the folder where it's going to put everything.
It will run some tasks, and then let you know when it's done. Once it is, go open up that my-game directory (or whatever else you named it- for the rest of this tutorial, we'll assume you named it my-game, though).
Exploring the Project
Inside the directory, you'll see a structure like this:
my-game
├── README.md
├── package.json
├── tsconfig.json
└── src
    ├── Box.ts
    ├── Draggable.ts
    ├── Floor.ts
    ├── Root.ts
    └── index.ts
You may notice those .ts files- these are TypeScript files.
If you're not familiar with TypeScript, don't worry! TypeScript usage in Hex Engine is entirely optional. That said, it's also highly recommended. Hex Engine's API has been designed to make your TypeScript exposure as little and as painless as possible. However, if you prefer to use plain JavaScript instead of TypeScript, you can rename those files so they end with .js.
Before we dig into the code, let's start up a local development server and see what we have so far in the browser. To do so, use a terminal emulator or command prompt to cd to your project directory (my-game, unless you changed it), then run this command within:
npm start
This will start a local web server running on your computer that you can use to develop your game. To connect to it, open up your browser to http://localhost:8080.
When you do, you'll see something like this:
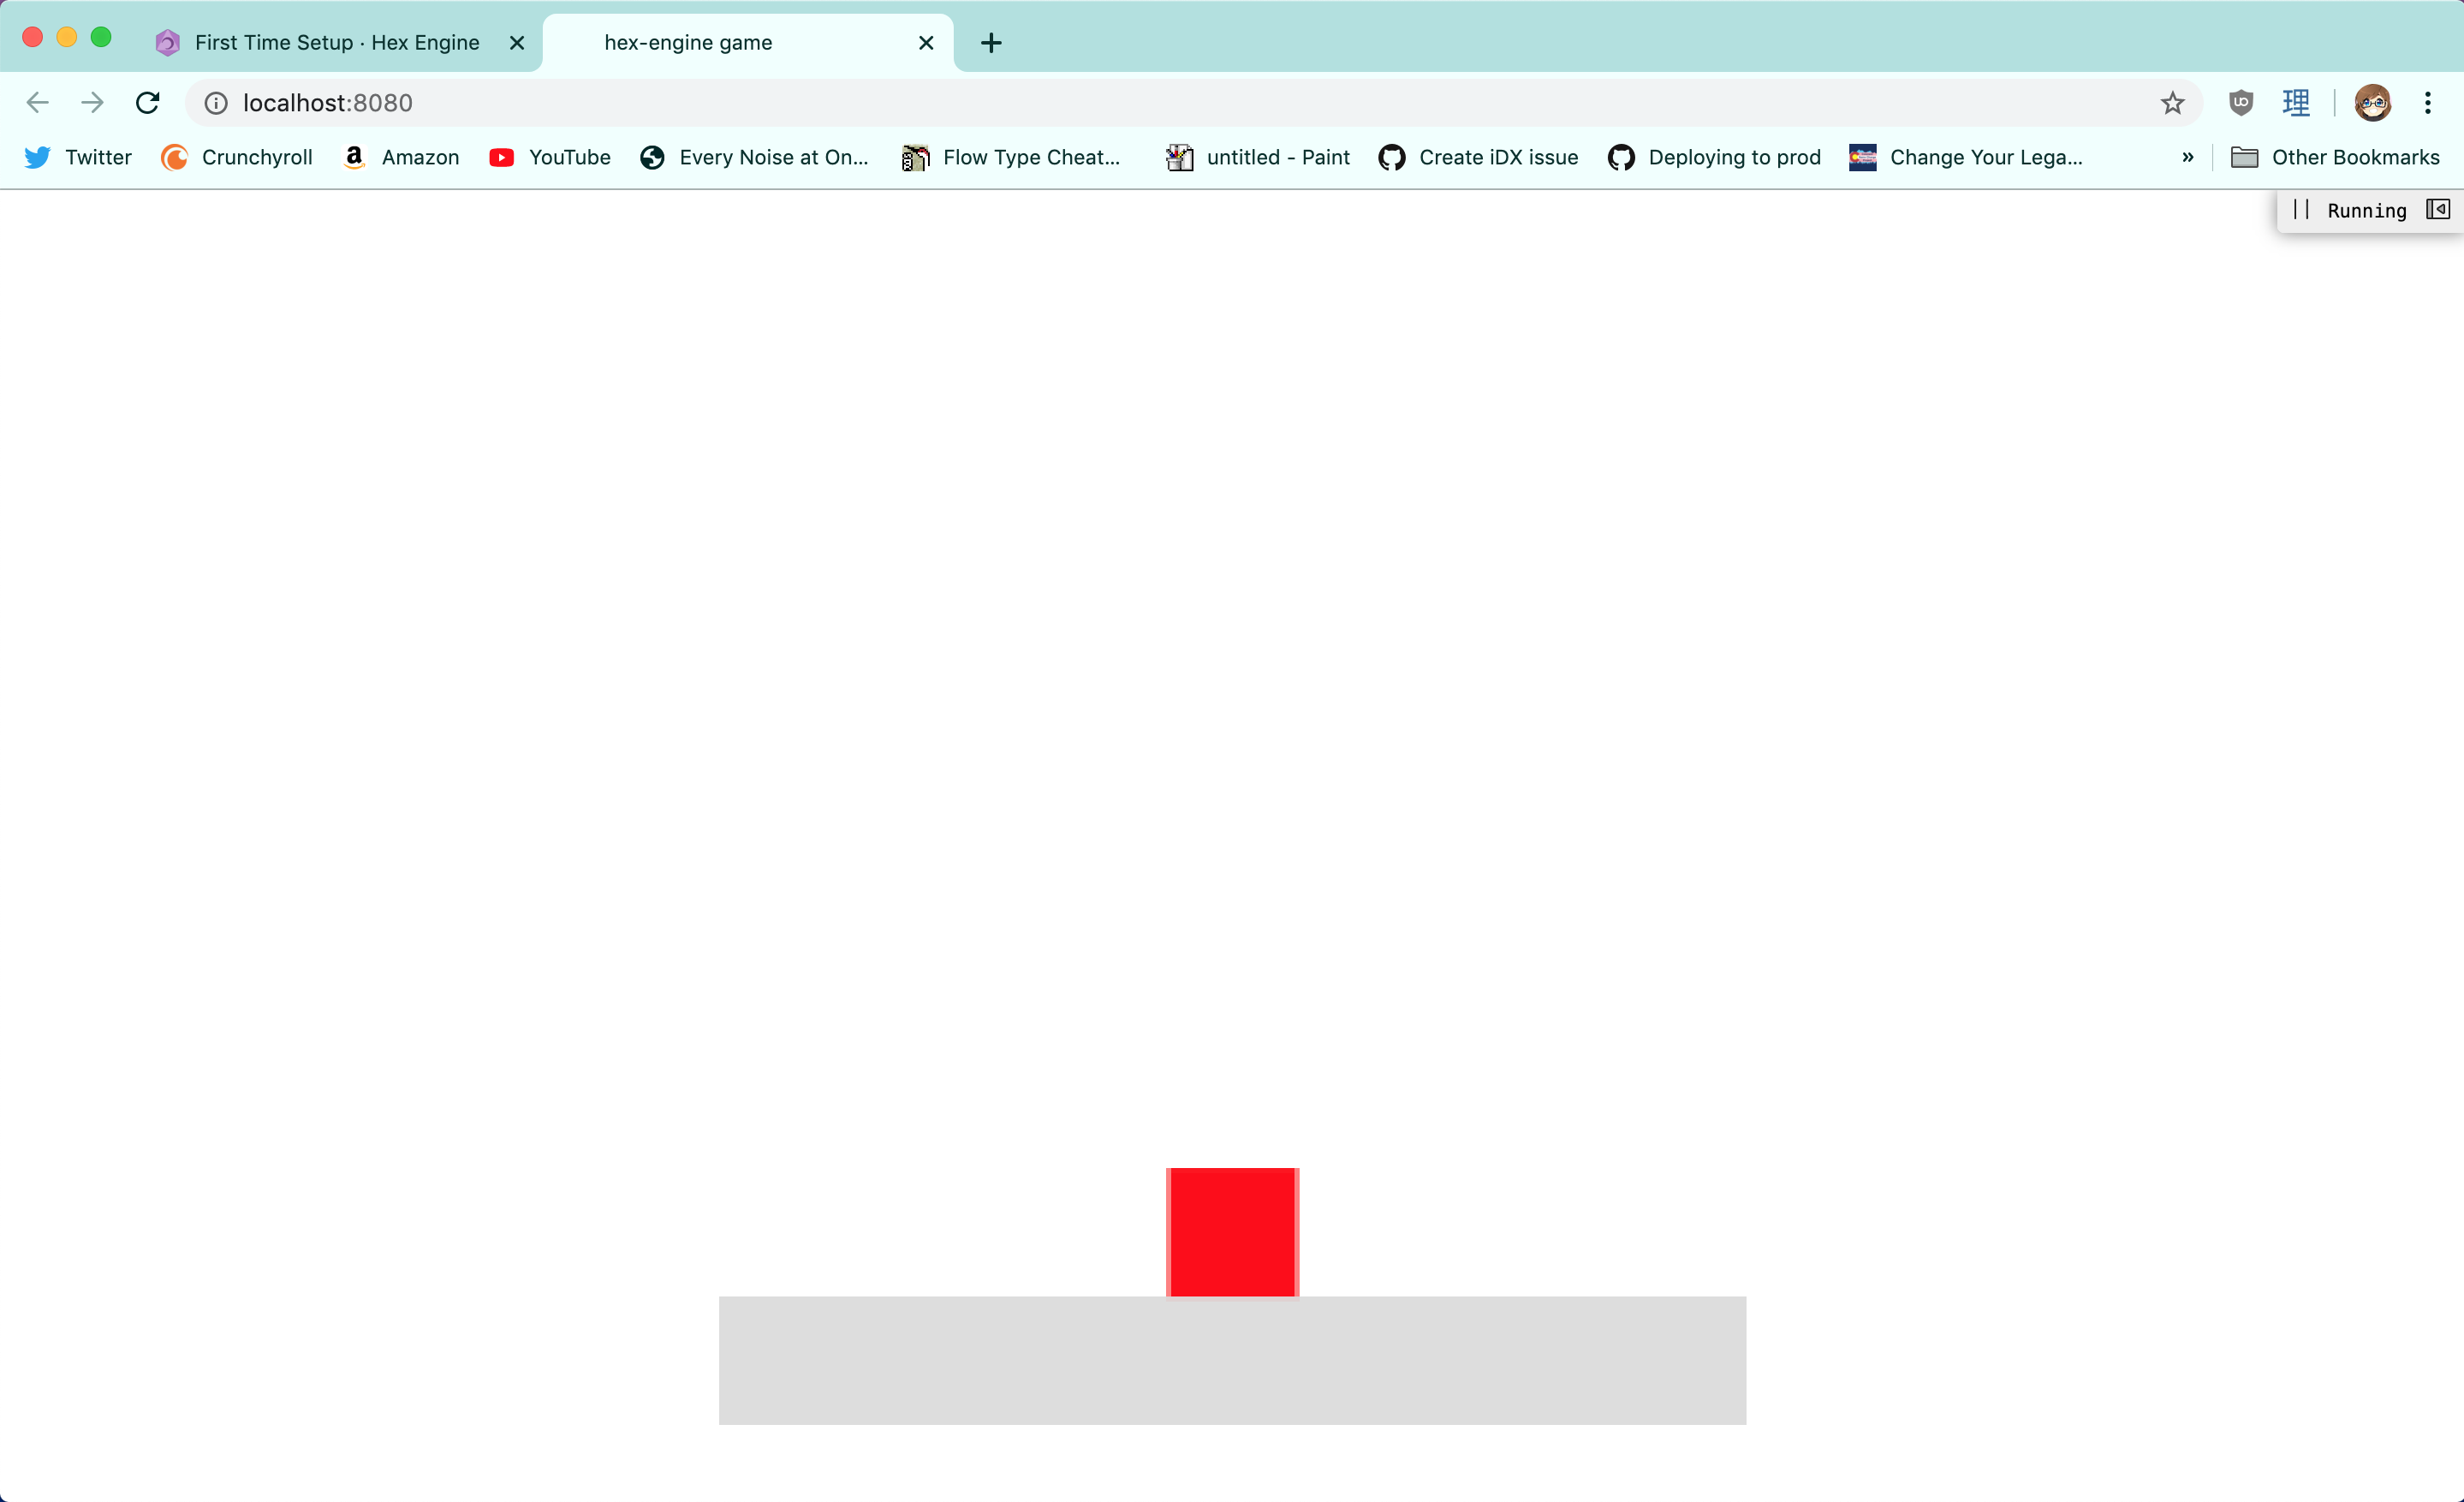
You can click and drag on the red box to move it around. When you let it go, it will fall back down.
The Inspector Bar
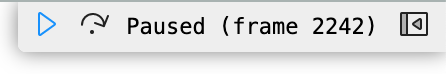
You may also notice the inspector bar in the upper-right:

This inspector bar is a useful debugging tool. It won't be present in your final game, though- it's just here for while you're working on it.
If you click the "Pause" button, the game will be paused, and the UI changes so you can step through the game frame-by-frame. This can be really helpful when debugging.
If you click the "Expand" button on the right, the inspector overlay pane will open, revealing a hierarchy view showing all the Entities currently loaded in the game.
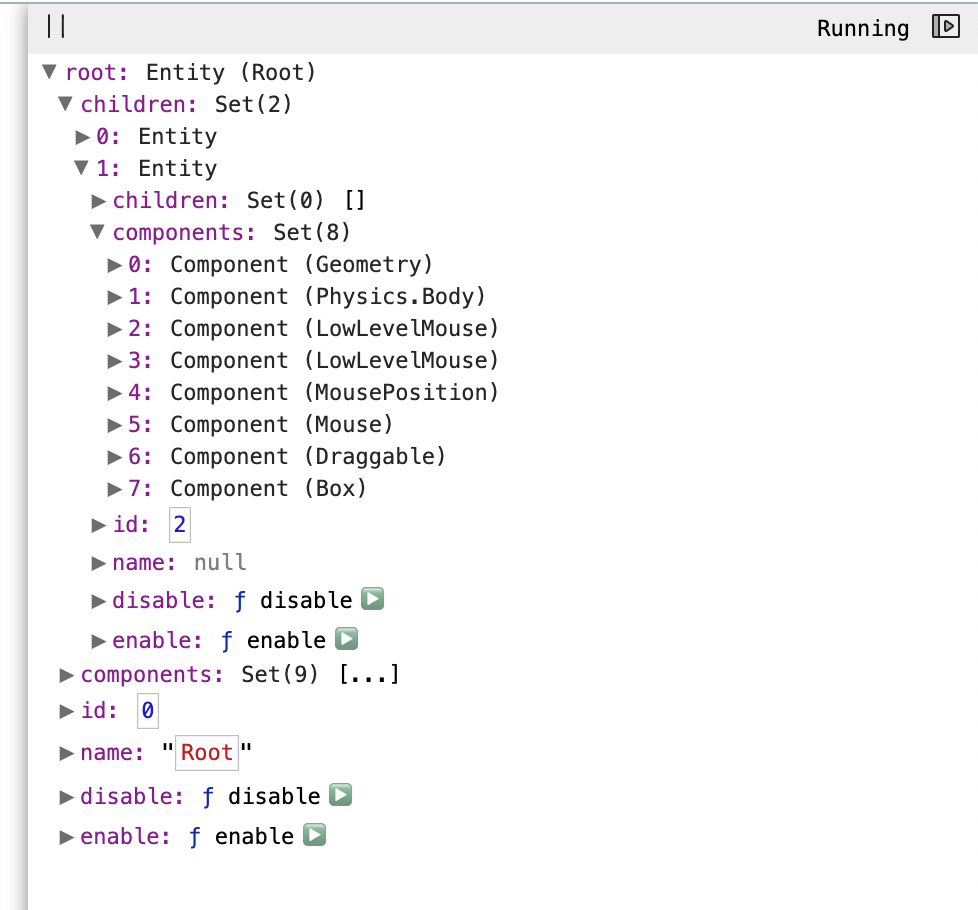
Try expanding root > children > 1 > components > 6. This is the Geometry component for the red box. It's not important right now what a Geometry component is; for now, try dragging the box around with the inspector pane open. You should see the position property on the Geometry component update. Pretty cool, eh?
Now try expanding root > children > 0 > components > 6. This is the Geometry component for the gray floor. Expand its position property and find its x and y properties. Try editing the properties; you should see the gray floor move around.
The inspector bar and inspector overlay pane are both invaluable tools not just for understanding what's going on in your game, but also for playing around with it.
In the next section, we'll dig into the code to get a better handle on what's going on.